How to Calculate Present Value of Annuity in Excel
You are offered a choice: $1,000 per year for the next five years, or a single lump sum today. How much is that stream of payments actually worth right now? The answer depends on the discount rate you use, and the math that gets you there - discounting each future payment back to today and summing them up - is the present value of an annuity.
This is one of the most frequently used calculations in finance: it drives loan analysis, pension valuation, lease accounting, and every “lump sum vs. installments” decision. Excel can handle it in a single cell.
This guide covers three scenarios - an ordinary annuity (fixed payments at the end of each period), an annuity due (payments at the beginning), and a growing annuity (payments that increase each period) - with the formulas, the Excel implementation, and a cross-check for each.
What the Present Value of an Annuity Measures
The present value of an annuity is the single lump sum today that is financially equivalent to a stream of equal future payments, given a chosen discount rate. It answers: “At discount rate , what lump sum today would be financially equivalent to this payment stream?”
The logic is the time value of money: a dollar today is worth more than a dollar next year, because you can invest today’s dollar and earn interest on it. Each future payment is therefore worth progressively less in today’s terms. The present value of an annuity is the sum of all those discounted amounts.
Two inputs are critical:
- The discount rate. There is no single universally correct number; it depends on the timing and risk of the cash flows. For very low-risk cash flows, Treasury yields can serve as a benchmark. For riskier cash flows, the discount rate should be higher. A higher rate always produces a lower present value.
- The payment timing. Payments at the end of each period (ordinary annuity) vs. the beginning (annuity due) shifts every payment by one period of discounting. The distinction matters most when the rate is high or the number of periods is large.
Ordinary Annuity: Fixed Payments at Period End
The Formula
Where:
- is the payment per period.
- is the discount rate per period.
- is the number of periods.
The fraction is PVIFA - the present value interest factor of an annuity - which we covered in a separate guide. Here we apply it directly with a payment amount.
Calculating It in Excel
Set up your data:
| Cell | Contents |
|---|---|
A1 | Payment |
A2 | 1000 |
B1 | Rate |
B2 | 0.05 |
C1 | Periods |
C2 | 5 |
D1 | Present Value |
D2 | (formula here) |
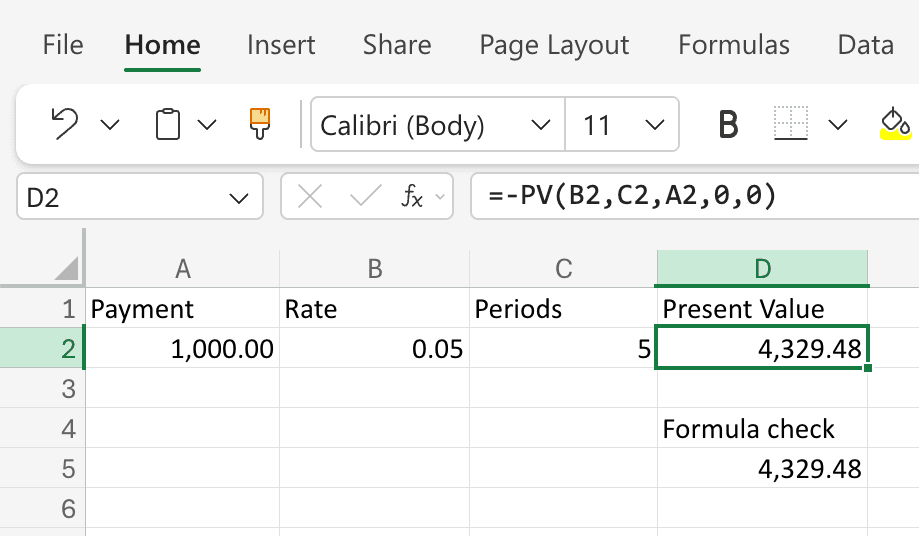
In D2, use Excel’s built-in PV function:
=-PV(B2, C2, A2, 0, 0)
The arguments:
rate- discount rate per period (B2).nper- number of periods (C2).pmt- payment per period (A2). Excel follows the standard cash-flow sign convention, so a positive payment produces a negative present value unless you negate the result.fv- future value,0(no balloon payment beyond the annuity).type-0for an ordinary annuity (payments at end of period).
For $1,000 per year, 5% rate, 5 years, Excel returns $4,329.48.
Cross-check with the closed-form formula
In D4 type Formula check, and in D5 type:
=A2*(1-(1+B2)^-C2)/B2
This should also return 4329.48, confirming the PV function result.
Annuity Due Variant
If payments occur at the beginning of each period (rent, lease payments, some retirement contributions), simply change the type argument to 1:
=-PV(B2, C2, A2, 0, 1)
For the same inputs, this returns $4,545.95 - about 5% more, because every payment is received one period earlier and therefore discounted one less time.
Alternatively, multiply the ordinary annuity result by :
=-PV(B2, C2, A2, 0, 0)*(1+B2)
Both approaches give the same answer.
Growing Annuity: Payments That Increase Each Period
A growing annuity is a payment stream where each payment rises at a constant rate per period. Real-world examples include a salary that rises 3% per year, a lease with annual escalation clauses, or expected dividends from a stock with steady growth.
Excel has no dedicated built-in function for the present value of a growing annuity, so you enter the formula directly.
The Formula When the Discount Rate and Growth Rate Differ
Where:
- is the first payment, assumed to arrive at the end of the first period. Each later payment equals . If payments begin immediately, treat the stream as a growing annuity due and adjust the timing.
- is the discount rate per period.
- is the growth rate per period.
- is the number of periods.
Note: this formula requires . When , the denominator is zero, and for the same end-of-period timing the present value simplifies to . That is why the equal-rate case is handled separately below.
Calculating It in Excel
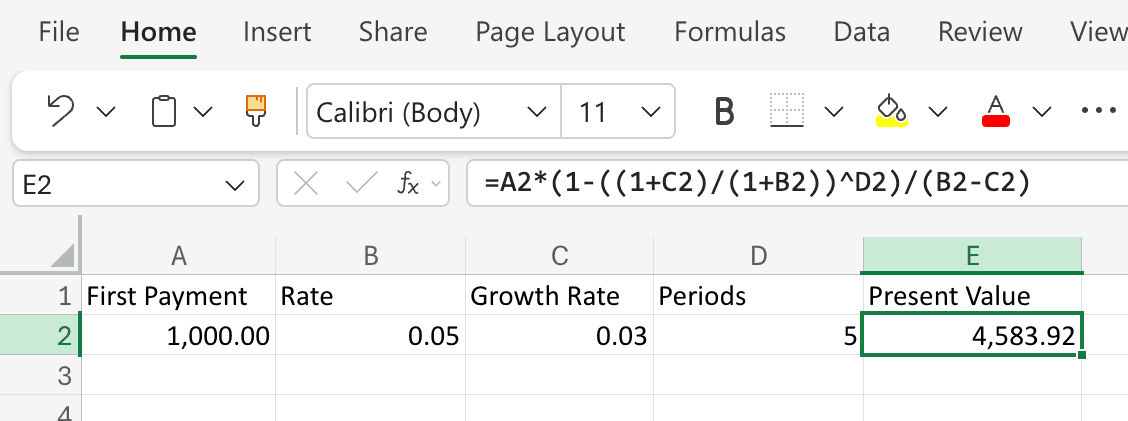
Set up your data:
| Cell | Contents |
|---|---|
A1 | First Payment |
A2 | 1000 |
B1 | Rate |
B2 | 0.05 |
C1 | Growth Rate |
C2 | 0.03 |
D1 | Periods |
D2 | 5 |
E1 | Present Value |
E2 | (formula here) |
In E2, type:
=A2*(1-((1+C2)/(1+B2))^D2)/(B2-C2)
For a $1,000 first payment, 5% discount rate, 3% growth rate, 5 years, Excel returns $4,583.92.
This is higher than the ordinary annuity’s $4,329.48 because each successive payment is larger (the second payment is $1,030, the third $1,060.90, and so on).
Cross-check by discounting each payment individually
To verify, you can build a small table that discounts each year’s payment separately:
| Year | Payment | PVIF | Discounted |
|---|---|---|---|
| 1 | $1,000.00 | 0.9524 | $952.38 |
| 2 | $1,030.00 | 0.9070 | $934.24 |
| 3 | $1,060.90 | 0.8638 | $916.50 |
| 4 | $1,092.73 | 0.8227 | $899.13 |
| 5 | $1,125.51 | 0.7835 | $881.68 |
| Total | $4,583.92 |
The sum matches the closed-form result.
Edge Case: Equal Discount and Growth Rates
If the discount rate equals the growth rate, the standard formula divides by zero. In this special case, the present value is:
In Excel, you can handle both cases with an IF statement:
=IF(B2=C2, A2*D2/(1+B2), A2*(1-((1+C2)/(1+B2))^D2)/(B2-C2))
This returns the correct result regardless of whether and happen to be equal.
Practical Applications
Loan evaluation
You receive two offers for a car loan: both have the same total payments, but different rates and terms. Computing the present value of each payment stream at the same discount rate tells you which is actually cheaper in today’s money.
Pension lump sum vs. monthly checks
Many pension plans offer a choice between a lump sum at retirement and monthly payments for life. The present value of the monthly stream - using a discount rate that matches your personal investment opportunities - is the number to compare against the lump sum.
Lease accounting
Under IFRS 16 / ASC 842, a lessee measures the lease liability as the present value of future lease payments. The right-of-use asset usually starts from that liability but may be adjusted for items such as prepaid lease payments, lease incentives, initial direct costs, and restoration or dismantling obligations. If lease payments escalate at a fixed annual rate, a growing-annuity-style framework may be appropriate; if they are fixed, the ordinary annuity formula works.
Common Mistakes
- Rate/period mismatch. If payments are monthly, divide the stated annual rate by 12 and convert the number of years into months as well.
- Forgetting the sign convention in
PV. Excel’sPVreturns a negative number whenpmtis positive. Either negatepmt(enter-A2) or negate the whole result (put a minus in front ofPV). Not handling this causes confusion when the “present value” comes back negative. - Using the ordinary-annuity formula for beginning-of-period payments. If the payments actually happen at the start of each period, you will understate the present value by a full period of discounting. Set
type = 1inPV, or multiply by . - Applying the growing-annuity formula when . The denominator becomes zero. Use the special-case formula or the
IFwrapper shown above. - Using the wrong discount rate. The formula is mechanical; the judgment is in the rate. Too low a rate overstates the present value; too high a rate understates it. Always test sensitivity by recalculating at 1-2 percentage points above and below your base rate.
Frequently Asked Questions
What is the difference between the present value of an annuity and PVIFA?
PVIFA is the present value per $1 of payment - a pure multiplier. The present value of an annuity is PVIFA * Payment. They encode the same math; PVIFA just factors out the payment amount so you can reuse the factor.
Can I use the PV function for a growing annuity?
No. Excel’s PV function only handles constant payments (ordinary annuity or annuity due). For a growing annuity you must enter the formula manually, as shown above.
How do I handle payments that change by a fixed dollar amount, not a percentage?
That is an arithmetic gradient annuity, not a growing (geometric) annuity. In practice, the simplest approach is to build a cash-flow schedule and discount each payment explicitly, using NPV for equal spacing or XNPV when dates are irregular.
Should I use a nominal or real discount rate?
Match the rate to the cash flow. If payments are fixed dollar amounts (nominal), use a nominal rate. If payments are expressed in constant (inflation-adjusted) dollars, use a real rate. Mixing them is a common source of error.
Why does doubling the number of periods not double the present value?
Because of discounting. Payments far in the future are worth much less today. The present value of an annuity rises with , but at a decreasing rate, and for a level perpetuity it approaches .
What discount rate should I use?
There is no universal answer. For a risk-free stream, use a Treasury yield of matching maturity. For a risky stream, add a risk premium - the rate should reflect the probability that payments might not actually arrive. In corporate finance, the weighted average cost of capital (WACC) is the standard benchmark. Always run a sensitivity analysis.