How to Calculate the 7-Day Yield in Excel
If you hold a money market fund, the 7-day SEC yield is one of the most useful numbers for estimating what the fund is earning right now. Unlike a 30-day or 12-month yield, it reflects the very recent rate environment, which matters when short-term rates are moving. Fund companies publish an official version, but if you have the underlying daily data - for a fund you manage, a cash vehicle you want to monitor, or a back-of-the-envelope check on a published number - you can build a close estimate in Excel in a few minutes.
This guide explains what the 7-day yield is designed to measure, walks through both the simple and the compounded annualization formulas in Excel, and points out the places where a homemade calculation will differ from the official published SEC figure.
What the 7-Day Yield Actually Measures
In practical terms, the 7-day yield is an annualized measure of the income a fund generated over its most recent seven days relative to the assets that produced that income. For money market funds, the official SEC version is more specific: it is based on a regulated seven-day base period return, net of expenses, and then annualized. That is why a homemade estimate can be very close to the published number without always matching it exactly.
Two things to keep in mind before doing any math:
- It is a backward-looking snapshot, not a forecast. A fund earning 5.20% over the last seven days is not promising 5.20% next week, next month, or next year. If short-term rates fall, the next reading will fall with them.
- The SEC yield is a specific, regulated version used for money market funds. When a fund reports its “7-day SEC yield,” it follows a prescribed net-of-expense calculation and annualization method. A yield you compute yourself from gross income figures will usually run higher than the official published number, because the SEC version deducts accrued expenses during the measurement period. We will reproduce both the simple and the compounded annualization here, but only a net-of-expense calculation built on the SEC-style base period framework should be expected to match the published figure closely.
The Two Annualization Formulas
For a simplified Excel estimate, suppose a fund earns total net income over a seven-day period on an average net asset base of . An approximate seven-day period return is:
There are two standard ways to scale that up to an annual rate.
Simple (linear) annualization treats each day as identical and multiplies by :
Compounded annualization (effective yield) compounds the same seven-day base period return over a full year. This is the convention used when funds quote a 7-day effective yield:
For typical positive money market yields, the compounded version is slightly higher. The gap is tiny at very low yields, but it can reach the low teens in basis points around 5% yields and widens as the underlying yield rises.
Calculating It in Excel
The Data You Need
For each of the seven days in your window, you need two figures:
- Daily net income earned by the fund. Ideally net of accrued daily operating expenses. If you only have gross interest, your answer will be biased high relative to the official SEC number.
- Daily net assets (for a fund, this is the daily NAV times shares outstanding; for a simple personal account, the principal balance at the start of the day).
If you are working from a personal savings account or a single bond holding with a stable principal, the same worksheet can still give you a practical annualized income estimate. Just keep in mind that in that case you are using the 7-day framework as an approximation, rather than reproducing an official fund-reported SEC yield.
Step-by-Step
Lay out your data with one row per day:
| Cell | Column |
|---|---|
A1:C1 | Headers: Date, Daily Income, Daily Net Assets |
A2:A8 | The seven dates |
B2:B8 | Daily income for each day |
C2:C8 | Daily net assets for each day |
Then add the calculation cells:
- Total 7-day income in
E2:=SUM(B2:B8) - Average daily net assets in
F2:=AVERAGE(C2:C8) - Simple annualized 7-day yield in
G2:
This is the linear version: take the seven-day period return=(E2/F2)*(365/7)E2/F2and scale it by365/7. - Effective 7-day yield in
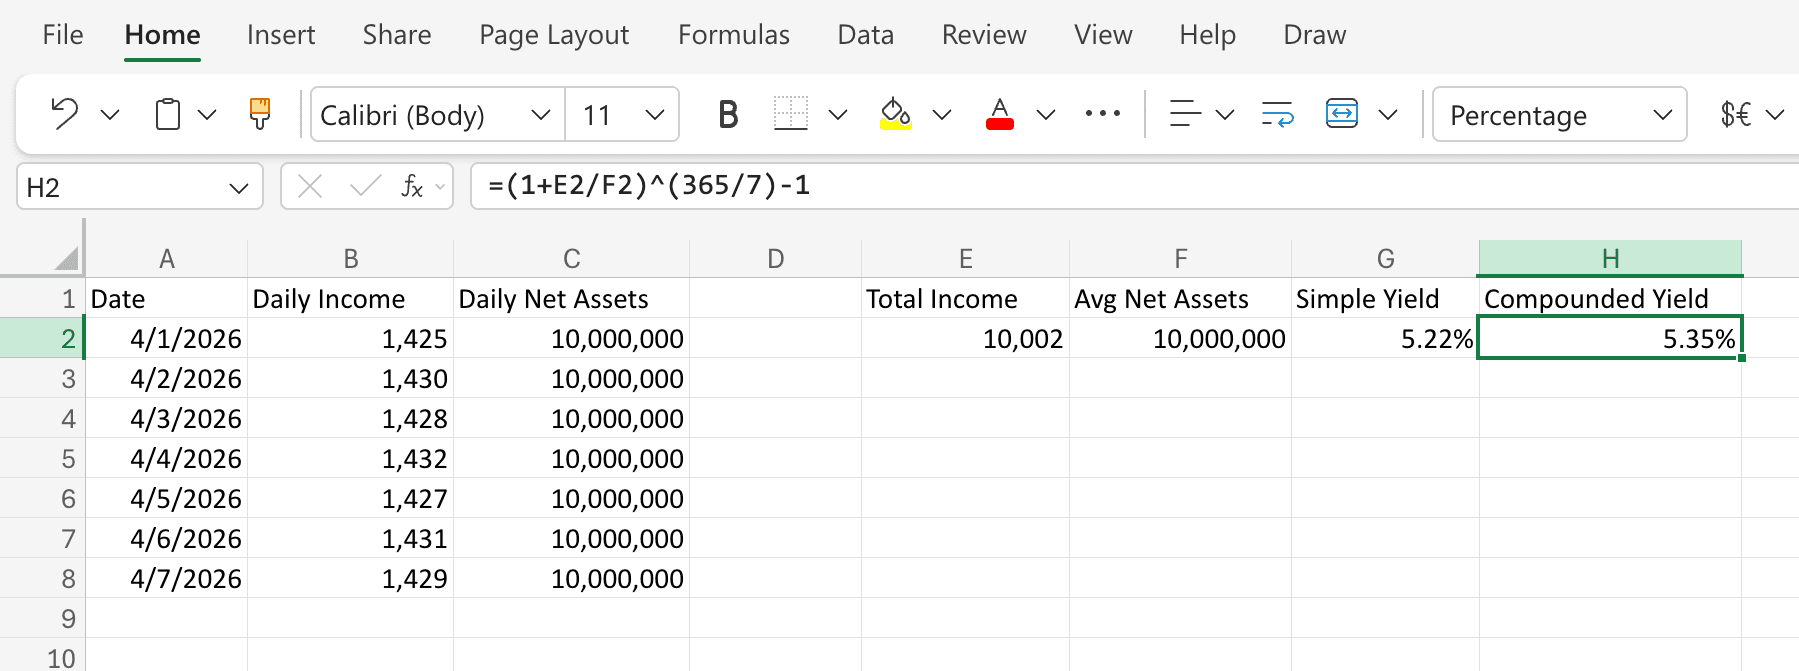
H2:
This is the effective-yield version. It matches a published 7-day effective yield more closely, while the standard 7-day SEC or current yield uses simple annualization.=(1+E2/F2)^(365/7)-1 - Format
G2andH2as percentages with two decimal places (e.g.,5.21%). Excel’s default percentage format is fine.
A Worked Example
Suppose a fund earns the following over seven days, on a stable $10,000,000 net asset base:
| Day | Daily income ($) | Daily net assets ($) |
|---|---|---|
| 1 | 1,425 | 10,000,000 |
| 2 | 1,430 | 10,000,000 |
| 3 | 1,428 | 10,000,000 |
| 4 | 1,432 | 10,000,000 |
| 5 | 1,427 | 10,000,000 |
| 6 | 1,431 | 10,000,000 |
| 7 | 1,429 | 10,000,000 |
Plugging in:
- Total 7-day income: $10,002
- Average net assets: $10,000,000
- 7-day period return:
- Simple annualized yield:
- Effective annualized yield:
The 13-basis-point gap between the two is the compounding effect. At very low yield levels (sub-1%) the gap shrinks toward zero; at higher yields it grows.
Where Your Number Will Differ From the Official SEC Yield
Even if your formula matches the SEC’s compounding convention exactly, your number may not match the published figure. The most common reasons:
- Gross vs. net income. SEC yield is computed after subtracting accrued daily fund operating expenses. If you only have the gross interest the portfolio threw off, you will usually overstate the yield, because the official published figure is based on income net of accrued expenses during the measurement period.
- Different seven-day window. The SEC yield is published for a specific reporting date. A window ending on a different day will pick up different daily rates.
- Income definition for money market funds. SEC Form N-1A’s performance-quotation rules use a specific base period return framework that excludes capital changes and non-investment income and reflects shareholder-level deductions. A simple sum of coupon receipts is only an approximation.
- Rounding and accounting conventions. Funds round to the nearest basis point and apply specific timing conventions for accruals.
If you are inside the fund and have access to the daily accounting data, you can match the official number to the basis point. From the outside, treat your calculation as an illustrative cross-check, not a substitute.
When the 7-Day Yield Is the Right Metric - and When It Is Not
Use it for: money market funds first and foremost, plus as a rough current-income check for other very short-duration vehicles whose returns come mostly from interest income rather than price movement. In those cases, the 7-day framework helps answer a practical question: what is this vehicle earning right now under current rate conditions?
Do not use it for: equity funds, longer-duration bond funds, or any vehicle whose return is driven heavily by price changes, spread moves, capital gains, or return of capital. For those, metrics like SEC 30-day yield, yield-to-maturity, duration, or total return are usually more informative.
Frequently Asked Questions
What is the difference between the 7-day yield and the SEC yield?
They are the same metric in concept. “SEC yield” specifically refers to the version standardized by the U.S. Securities and Exchange Commission, which mandates net-of-expense income, simple annualization for the standard current yield, and a specific reporting window. A separate 7-day effective yield uses the same base period return but compounds it over the year. A “7-day yield” you compute yourself from raw data may differ from the official SEC figure depending on your inputs.
Why annualize at all if it is only based on seven days?
Annualizing makes the figure comparable to other yields (Treasury bill rates, savings account APYs, bond yields-to-maturity), all of which are quoted on an annual basis. Without annualization, a “0.10% return over 7 days” is hard to compare to anything.
Should I use the simple or the compounded formula?
If you are trying to match a published SEC yield, use the compounded formula - that is the closer match to the official effective-yield convention used in money market disclosures. If you are doing a quick internal calculation and the underlying yield is small, the simple formula is easier and will usually be close. But when precision matters, the effective-yield version is the better choice.
My calculated yield is higher than the fund’s published SEC yield. Why?
The most likely reason is that you used gross income instead of income net of operating expenses. Other common causes are a different seven-day window, missing amortization adjustments, or comparing your effective-yield calculation with a fund’s standard 7-day SEC yield.
Is the 7-day yield a good predictor of next year’s return?
No. It is a snapshot of current conditions. If short-term interest rates change - and for money market funds they often do - your realized return over the next year will differ, sometimes substantially. Treat the 7-day yield as a “what is this fund earning today” indicator, not as a forecast.
Where can I find the official 7-day SEC yield for a fund?
It is required disclosure for money market funds and is usually available on the fund sponsor’s website, in the prospectus or shareholder report, and on established fund-research platforms such as Morningstar or Bloomberg. For fund-to-fund comparisons, rely on the official published figure rather than a homemade estimate.